BESS Project Economics: What Shapes Performance, Bankability, and Returns
Battery energy storage systems are often introduced through specification-sheet metrics: power, energy, and duration. Those figures are useful, but they are only the starting point. They tell us the size of the asset, not how it will behave in operation, how much usable energy it will actually deliver, or how its performance will evolve over time.
For lenders, developers, and investors, that distinction matters. A BESS asset is not a static container of stored electricity. It is a dynamic operating system whose output is shaped by cycling behaviour, depth of discharge, state of charge, state of energy, efficiency, degradation, and the conditions under which it is deployed.
That is why BESS performance cannot be assessed through capacity alone. The real question is not what the system is rated to do, but what it can reliably deliver under real operating conditions, and what that means for project economics, bankability, and long-term returns.
Discharge intensity changes the duration equation
The same stored energy produces different outcomes depending on how it is discharged. A 20 MWh system at 5 MW delivers 4 hours, at 10 MW delivers 2 hours, and at 20 MW delivers 1 hour. In other words, duration changes with discharge power, even when stored energy stays the same.
A cycle is defined by total energy throughput, not elapsed time. Charging 20 MWh and discharging 20 MWh processes 40 MWh in total, even though net delivered energy is 20 MWh. This is why the industry tracks Equivalent Full Cycles (EFC) rather than simple cycle counts.
State of charge is calculated from measurements
State of charge (SoC) is the ratio of remaining charge to maximum charge capacity.
| SoC = |
|
× 100 |
SoC is expressed as a percentage and indicates the proportion of energy available at a given point in time. It is calculated by the Battery Management System using sensor data such as current, voltage, and temperature. Because the estimate relies on sensor inputs and current integration over time, small inaccuracies can accumulate, causing the displayed SoC to drift from actual stored energy.
SoC also does not guarantee deliverable output. A pack may show a non-zero SoC while unable to continue discharging because individual cells differ in capacity, internal resistance, and voltage response. When the weakest cell reaches its operating limit, the system stops, even if energy remains elsewhere in the pack. In that sense, SoC describes stored energy, but it does not by itself describe how much energy can still be delivered.
Depth of discharge determines usable capacity
Depth of discharge (DoD) is the proportion of nameplate capacity actually discharged in a cycle.
| DoD = |
|
× 100 |
A system with 100 kWh nameplate capacity that discharges 80 kWh has operated at 80% DoD.
| DoD = |
|
× 100 = 80% |
Since total battery capacity is fixed, DoD and state of charge are complementary.
| DoD (%) + SoC (%) = 100% |
In practice, batteries are not operated across the full 0%–100% range. System operation is constrained within predefined limits to ensure reliability, longevity, and warranty compliance. Deep discharge cycles increase stress on battery materials, raise thermal load, and reduce cycle life, so the usable operating window is typically narrower than the nameplate implies.
State of energy reflects deliverable energy
State of energy (SoE) is the ratio of remaining usable energy to total usable energy capacity.
| SoE = |
|
× 100 |
SoE and SoC are not the same quantity and do not move proportionally under operating conditions. SoC tracks stored charge; SoE tracks deliverable energy, which depends on terminal voltage under load. As current rises, internal losses increase, voltage drops, and the amount of usable energy that can actually be dispatched declines.
At the same 50% SoC, SoE can differ under low-load and high-load conditions because the same charge level does not always translate into the same deliverable energy. That is why SoE is the more operationally relevant figure for dispatch planning and scheduling, while SoC remains a state indicator rather than a dispatch metric.
Speed of delivery carries a cost
C-rate is the ratio of charge or discharge power to battery capacity.
| C-rate = |
|
For a 100 kWh battery:
- At 1C, power is 100 kW and full discharge takes roughly one hour.
- At 0.5C, power is 50 kW and discharge takes roughly two hours.
- At 2C, power is 200 kW and discharge takes roughly 30 minutes.
Higher C-rate operation increases current flow, raises internal losses, and increases operating temperature. Lower C-rate operation reduces electrical and thermal stress and sustains operation over longer durations. This is not incidental. C-rate selection is driven by the intended application: frequency regulation demands high C-rate operation, while peak shaving or energy shifting generally calls for lower C-rate operation.
A related figure, P-rate, expresses the same relationship at the system level, meaning power relative to total energy capacity rather than the cell level. It is more commonly used in system-level design and economic modelling than in cell-level thermal and safety design.
A battery’s capacity is not fixed across its lifetime
State of health (SoH) is the ratio of current maximum capacity to original nameplate capacity.
| SoH = |
|
× 100 |
A battery originally rated at 100 kWh that can now deliver only 80 kWh under the same conditions has an SoH of 80%.
| SoH = |
|
× 100 = 80% |
Energy is lost at every stage
Round-trip efficiency (RTE) is the ratio of energy delivered during discharge to energy absorbed during charging.
| RTE = |
|
× 100 |
If 100 kWh is supplied during charging and 90 kWh is delivered during discharge, RTE is 90%.
| RTE = |
|
× 100 = 90% |
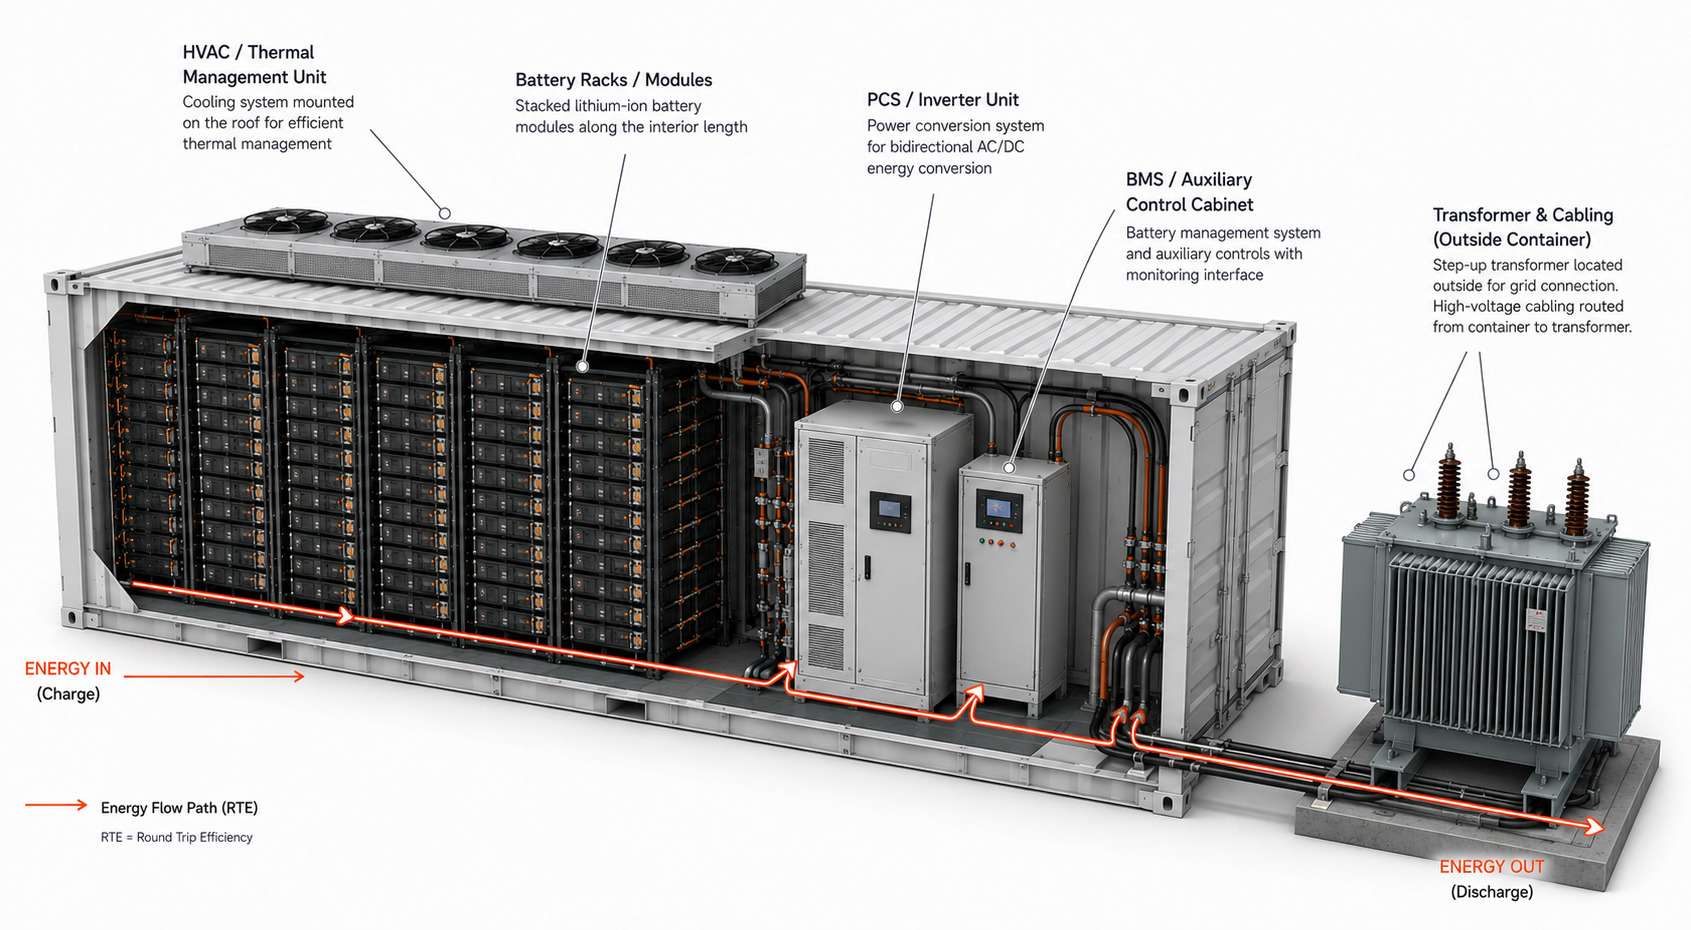
That means 10 kWh is lost across the full cycle before it reaches the point of delivery. The loss is not concentrated in one component; it accumulates across battery internal resistance, power conversion (AC-DC inversion), thermal management (cooling load), auxiliary systems (controls, BMS, monitoring), and electrical infrastructure (cables, transformers). Lower RTE means more input energy is required to produce the same delivered output, which raises the cost of delivered energy and reduces returns over the asset’s life.
More cycling trades life for revenue
At 80% DoD with a 6,000-cycle rating, a system cycled once a day lasts approximately 16 years.
|
≈ 16.4 years |
Cycled twice a day, the same 6,000-cycle asset is consumed in roughly half the time, approximately 8 years.
|
≈ 8.2 years |
This is the central commercial trade-off in BESS design: more frequent cycling increases near-term revenue potential but compresses asset life through faster degradation, while conservative cycling extends life at the cost of lower revenue capture. For developers, this is a procurement and contract-structuring decision. For lenders, it is a direct input into revenue and asset-life assumptions underwriting the financing case.
Duration and cycling govern different things. Duration, the hours a system can sustain output, determines peak shaving capability, backup runtime, and compliance with contract requirements such as a 2-hour or 4-hour tender. Cycling, the number of charge-discharge events over time, determines asset life, drives degradation, and shapes revenue potential over the project's tenor. A system that meets a tender's duration requirement at commissioning can still underperform financially over a 15-year term if its cycling strategy was not built around the same assumptions.
Site conditions change output
BESS units are rated under standard conditions, but actual performance is governed by environmental exposure, site configuration, and operating conditions. High-temperature conditions force cooling systems to run more continuously, consuming energy that would otherwise be dispatched and reducing deliverable energy. Low-temperature conditions increase internal resistance, so energy may remain stored while discharge capability falls.
This variation also appears within a single plant. Units in sun-exposed areas carry higher thermal load, while shaded units or those with better airflow deliver more of their stored energy. Densely packed rows can create local heat build-up and lower output even when the underlying design is identical. For due diligence, deliverable energy should therefore be assessed at the site and layout level, not assumed uniform from aggregate nameplate rating alone.
Practical distinction
In a BESS asset, capacity is specified. Performance is managed. Nameplate numbers set the starting point for comparison, but deliverable energy, asset life, and revenue outcomes are determined by depth of discharge, cycling pattern, C-rate, degradation trajectory, round-trip efficiency, and the operating environment.
EES verifies degradation assumptions, cycle life, and grid readiness against project return models for lenders and developers evaluating BESS and hybrid assets. Explore our lender’s engineering services for BESS and hybrid projects.

Please rotate youauto-rotater device to portrait mode to login.